


America’s immigration story isn’t a single narrative — it’s a constantly shifting mosaic, shaped by wars, labor shortages, laws, borders, and opportunity. When you look at immigration state by state, decade by decade, something fascinating emerges: the “typical immigrant” to America has never been static.
This is a guided walk through how immigration patterns changed from 1850 to 2010, and how each era quietly reshaped the country we know today.
1850: Ireland and Germany Power Early America
In 1850, the overwhelming majority of immigrants arriving in the United States came from Ireland and Germany.
- Irish immigrants were fleeing famine and political repression
- Germans were escaping economic hardship and failed revolutions
They settled heavily in the Northeast and Midwest, laying the foundations of cities that still carry their cultural fingerprints today.
Explore more:
- Library of Congress – Irish Immigration: https://www.loc.gov/classroom-materials/immigration/irish/
- Smithsonian – German Immigration History: https://www.smithsonianmag.com/history/german-american-history-180965191/
1860s: War Creates Opportunity
The Civil War didn’t just reshape politics — it reshaped labor.
With millions of men fighting, labor shortages exploded, and demand for immigrant workers surged. In just one decade, the foreign-born population nearly doubled.
America needed workers. Immigrants answered.
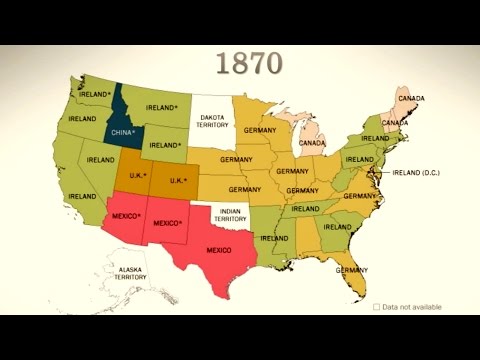
1870: Borders Matter
By 1870, geography played a bigger role:
- Mexico became the top country of origin across much of the Southwest
- British immigrants gravitated toward the Rocky Mountain territories
This was immigration driven less by ships — and more by proximity.
1880: The Rise (and Risk) of Chinese Immigration
The 1880 census revealed a dramatic increase in Chinese immigrants, many of whom took on the most dangerous work available:
- Mining
- Railroad construction
- Industrial labor
Their contribution was massive — and so was the backlash.
Learn more:
- National Archives – Chinese Railroad Workers: https://www.archives.gov/education/lessons/chinese-immigration
- Stanford Chinese Railroad Workers Project: https://web.stanford.edu/group/chineserailroad/cgi-bin/website/
1882: Exclusion Becomes Law
The Chinese Exclusion Act of 1882 halted most Asian immigration for nearly a century — one of the most explicit racial exclusions in US immigration history.
To make matters worse for historians, the 1890 census microdata were destroyed in a 1921 fire, creating a rare blind spot in America’s demographic record.
Context:
- National Archives – Chinese Exclusion Act: https://www.archives.gov/milestone-documents/chinese-exclusion-act
1900: A New Century, New Origins
By the turn of the century, US territorial boundaries had settled — and new immigrant groups rose to prominence:
- Norwegians in South Dakota
- Swedes in Minnesota
- Italians in Louisiana
This was the beginning of America’s deep European diversification.
1910: Change Happens Fast
Just ten years later, immigration patterns shifted again:
- Russians and Italians surged nationwide
- Ireland, once dominant, was the top origin in only Delaware
Immigration flows were becoming more complex — and more volatile.
1920: Fleeing War, Building America
By 1920, America’s population surpassed 100 million.
Immigrants from Germany, Italy, and Russia arrived in nearly equal numbers, many fleeing the devastation of World War I. These communities would shape labor movements, urban politics, and American culture for decades.
1930: Industry Grows, Immigration Slows
With industrialization booming and population growth happening internally, the percentage of foreign-born Americans fell.
Yet one shift stood out:
For the first time since 1850, Mexico became the top country of origin for California.
1940: Restriction Takes Hold
Immigration quotas and restrictive laws from the 1920s and 1930s had their intended effect.
By 1940, the foreign-born population dropped below 9%, a sharp contraction that would last decades.
1950: Reopening the Door
The repeal of the Chinese Exclusion Act finally allowed Chinese immigrants to return.
Unexpectedly, Greeks became the largest immigrant group in South Carolina, a reminder that immigration stories are often hyper-local and surprising.
1960: Two New States, Two Very Different Journeys
When Alaska and Hawaii became states in 1959, immigration patterns reflected geography:
- Canadians crossed a land border into Alaska
- Filipinos crossed the Pacific to Hawaii
Two states, two migration logics.
1970: The Lowest Point
By 1970, the foreign-born population reached its lowest percentage in US history.
Immigrants now came from a wider range of countries, but Italy was the only nation to have sent more than one million people up to that point.
1980: Mexico’s Influence Expands
Changes in US visa policy dramatically increased immigration from the Western Hemisphere.
In just one decade:
- The number of states where Mexico was the top origin doubled
- Mexico became the dominant immigrant origin nationwide
1990: The America We Recognize Today
By 1990, modern diversity patterns were clearly visible:
- Mexico led in 18 states
- Dominicans became the largest group in New York
- South Korea and Southeast Asian nations dominated in seven states
This was the beginning of America’s truly global immigrant identity.
2000: India Emerges
By 2000:
- Mexican-born immigrants surpassed nine million
- India became the top country of origin in three states, reflecting the rise of skilled and professional immigration
2010: A Tipping Point
The 2010 census revealed something striking:
Only five states — all bordering Canada — received most immigrants from majority-white countries.
Everywhere else, immigration was driving rapid racial, cultural, and linguistic diversification.
Why This History Matters
Immigration isn’t a recent controversy — it’s the engine of American change.
Every decade reflects:
- Economic needs
- Political decisions
- Global crises
- Human ambition
Understanding this timeline helps explain not just who America is today — but why.
Want to Explore This Visually?
Interactive immigration maps and datasets:
- US Census Bureau Immigration Data: https://www.census.gov/topics/population/foreign-born.html
- Migration Policy Institute Data Hub: https://www.migrationpolicy.org/programs/data-hub
- Our World in Data – Migration: https://ourworldindata.org/migration


?")
")
